American football still sits alone at the top of the U.S. sports market. The fight starts underneath it.
Gallup's first poll after the 2026 World Cup put American football first on 31%, basketball second on 11%, baseball third on 10% and soccer fourth on 9%. Read only the topline and the old hierarchy survives. Look at what Americans actually watch and it starts to fall apart.
Gallup asked for one favourite sport. It did not measure viewing time, reach, ticket demand or the football split between Liga MX, the Premier League, Champions League, LaLiga, MLS and national teams, across English, Spanish, linear television and streaming. Count the sport rather than each rights package and the picture changes.
SportsGlare's call is simple: soccer is now America's No. 2 sport.
Favourite sport
9% soccer10% baseball · 11% basketball
Gallup’s national ±4 point margin covers the whole 9–11% spread.
Actual viewing
79.8bn minutesU.S. soccer viewing in 2025
Nielsen’s whole-sport measure, not a single league rating.
2026 scale
84bn+ minutesWorld Cup viewing in June alone
Before later knockouts, the final and the rest of 2026.
Live demand
21,988 per matchMLS average attendance, 2025
Above the NBA’s 18,147 and NHL’s 17,542.
Gallup's fourth place is not much of a fourth place
Soccer's 9% sits one point behind baseball and two behind basketball. In late 2023, Gallup had soccer at 5% and American football at 41%. The gap below the leader has compressed quickly.
Gallup's published national margin of sampling error is ±4 percentage points, wider than the full spread between soccer, baseball and basketball. That does not make the three results interchangeable, but it does make one thing clear: Gallup measured a tight contest for second, not a settled fourth place for soccer.
The cross-tabs are more striking. Soccer is already second by point estimate among men, adults aged 35 to 54, households earning under $50,000 and respondents educated to high-school level or below. Among non-white respondents it is joint second with basketball.
Gallup point estimates, survey conducted 3–24 August 2026. Gallup publishes a ±4 percentage-point margin of sampling error for the national sample. Subgroup positions are point estimates.
The 35-to-54 result is the one that breaks the old story. Soccer on 14% in that group is not a youth-market promise for some future decade. It is a mainstream audience now.
Americans were already watching 79.8 billion minutes of soccer
Nielsen says U.S. viewers spent 79.8 billion minutes watching soccer in 2025. That is the more useful starting point because it treats soccer as one sport rather than asking MLS, the Premier League or Liga MX to stand in for the whole market.
Soccer is unusually fragmented in the United States. A supporter can watch Premier League in the morning, LaLiga in the afternoon, Liga MX at night and MLS at the weekend, sometimes in English and sometimes in Spanish. Those audiences appear in different rights reports and different ratings stories, but they are all football consumption.
Nielsen's own 2025 work identified Liga MX, the Champions League and the Premier League as the three biggest U.S. soccer properties by viewership. Any ranking built around MLS alone, or around English-language television alone, starts with a large part of the market missing.
The World Cup changed the scale
Nielsen says World Cup matches generated more than 84 billion minutes of U.S. television viewing in June alone across FOX, FS1 and Telemundo. Its June reporting interval ended before the biggest knockout matches and before the final. In less than a month of measured tournament viewing, the World Cup had already produced more U.S. viewing than Nielsen recorded for all soccer across the whole of 2025.
The full tournament averages show why. FOX's English-language coverage averaged 7.737 million viewers across all 104 matches. Telemundo and Peacock reported a 6.3 million Spanish-language Total Audience Delivery average across those same 104 matches. The final pushed the split into full view: FOX's match-only window averaged 42.5 million, while Telemundo and Peacock reported 23.9 million for the Spanish-language presentation.
The reported Spanish-language audience was 56% as large as the English-language audience.
TelevisaUnivision accounted for 47% of U.S. soccer viewing among adults aged 18–49 from January through May 2026. Liga MX was the country’s most-watched club soccer league.
The American soccer audience is not an English-language audience with a Spanish-language add-on. It is a bilingual market at national scale.
America's biggest club-football market speaks Spanish
TelevisaUnivision says the 2026 Liga MX Clausura reached 21.6 million U.S. viewers and describes Liga MX as the country's most-watched club soccer league regardless of language. From January through May, its networks accounted for 47% of all U.S. soccer viewing among adults aged 18 to 49.
That makes the measurement problem obvious. If America's biggest club-football audience is largely consumed in Spanish, then an English-first sports hierarchy will systematically undersell soccer.
LaLiga adds another large audience. ESPN says the competition reached 20.1 million U.S. viewers during the 2025/26 season. The season-long viewing-minute totals published for LaLiga and the Premier League are not cleanly comparable, so SportsGlare does not rank the two against each other. Taken together, though, the published figures point to more than 20 billion minutes of U.S. viewing across those two leagues alone, before Liga MX, Champions League, MLS or national-team football are added.
This is why soccer keeps looking smaller than the audience actually is. Its biggest properties are sold separately, measured separately and discussed separately. The sport is larger than any one of those pieces.
The post-World-Cup audience held
The first club numbers after the tournament do not look like a market snapping back to its old level. Brentford against Tottenham averaged 1.2 million across NBC and Peacock on opening weekend. Elche against Barcelona drew 1.0 million on ABC. Espanyol against Real Madrid added 811,000 on ESPN. These were ordinary early-season club matches, not national-team events riding the World Cup itself.
MLS has moved in the same direction. The league says it averaged 7.9 million live match viewers per week through the first three months of 2026 across Apple TV, domestic linear partners, Canada and international distribution: a 62% year-on-year increase on its reported comparison basis. After the World Cup, Reuters reported league figures showing ticket sales up 62% compared with the 40 days before the tournament, while MLS said recent TV audiences were up 40% to 50%.
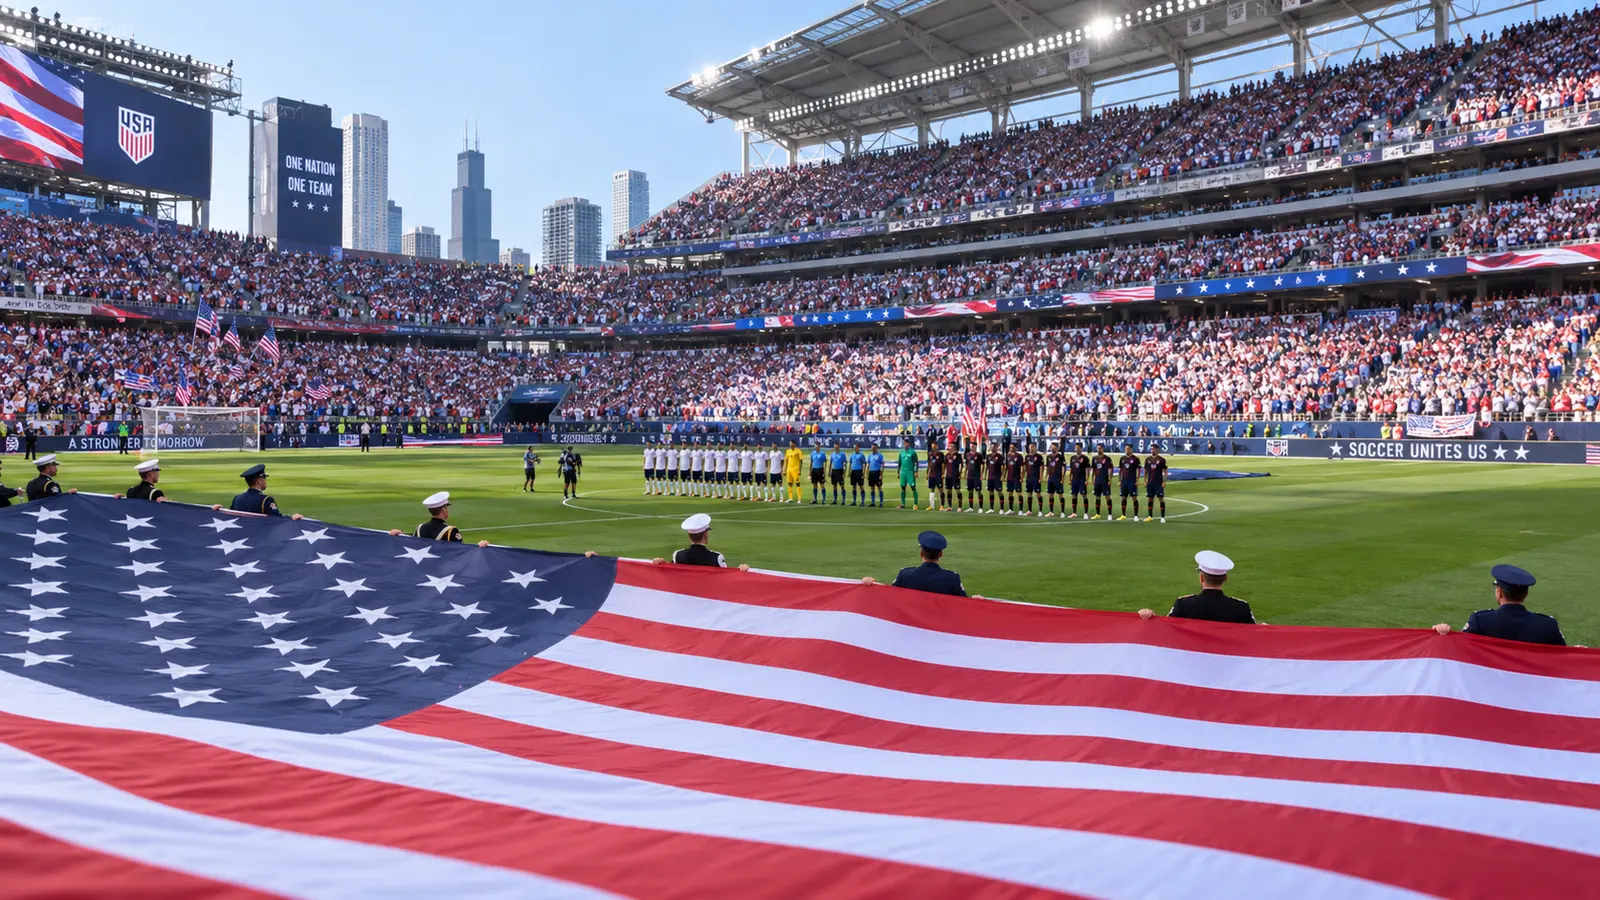
The stadium numbers reinforce the point. On 9 September, 63,094 attended Chicago Fire against Inter Miami at Soldier Field, a club record. MLS averaged 21,988 spectators per regular-season match in 2025. Through May 2026, its published average was 22,109.
Average regular-season attendance. Venue sizes and season structures differ, so this measures live demand rather than total national popularity.
84bn+ is only World Cup viewing during Nielsen’s June reporting interval. It excludes the later knockout rounds, the final and all other soccer viewing outside that interval.
Published measurement universes differ. Soccer’s 2026 range is a SportsGlare projection based on Nielsen’s 84bn+ June measurement, the 79.8bn 2025 baseline and continued post-World-Cup viewing. Baseball is not plotted because no comparable public whole-sport viewing-minute total is available.
The old ranking no longer fits
There is no perfect public table ranking every American sport on one identical measurement basis. Baseball has huge local inventory. Basketball is split between national and local rights. College football is measured through a different structure again. Soccer has perhaps the most fragmented rights map of all.
American football remains first by a distance. Below it, describing soccer as America's fourth sport now requires its audience to be split by competition, language and platform before it is counted. Gallup cannot statistically separate soccer from baseball and basketball at the national level, Nielsen already measured almost 80 billion minutes of soccer before the home World Cup, Spanish-language viewing is central rather than peripheral, and the post-tournament audience has held. The old hierarchy no longer fits the market.
Soccer is now America's No. 2 sport.
Sources
Primary sources
- Gallup: Football Still Top U.S. Sport, Soccer Inching Up
- Gallup: August 2026 favourite-sport cross-tabs
- Gallup: 2023 favourite-sport baseline
- Nielsen: The Round Out
- Nielsen: June 2026 Gauge
- FOX Sports: 2026 FIFA World Cup audience report
- Telemundo and Peacock: Spanish-language 2026 World Cup audience report
- TelevisaUnivision: May 2026 soccer portfolio and Liga MX reach
- ESPN: LaLiga 2025/26 audience report
- NBCUniversal: Premier League 2025/26 audience report
- MLS: 2026 viewership and attendance update
- MLS: 2025 attendance summary
- MLS: Chicago Fire attendance record
- MLB: 2025 attendance and MLB.TV consumption
- Nielsen: Tops of Sports, MLB postseason 2025
- NBA: 2025/26 regular-season audience report
- NHL: 2024/25 attendance record
- SFIA: 2026 soccer participation report